Prashanth ‘PB’ Belathur is an Application Modernization Leader in VMware Tanzu Labs (formerly Pivotal), with extensive experience leading modernization, cloud migration and AI/ML engagements in the finance, insurance, banking, logistics, airline, ecommerce, telecom, healthcare, and retail verticals.
Less Is More for Database Connection Pools
TL;DR
- A well-behaved spring boot application running in a single-tenant host, when deployed in a multi-tenant host (cloud) degrades the performance of other applications on the same host.
- The default Hikari Connection Pool configuration in your spring boot app is usually oversized and, a few of the properties are set to the upper limit. These properties need to be downsized for deployment in a multi-tenant host environment to minimize the noisy neighbor impacts.
Recommendations
Applicable for any spring boot application using HikariCP and deployed in the cloud (PCF, AWS, Azure etc.)
keep pool size under 10 connections per application instance.
always specify the idle timeout, the default 10s is usually high for quick response apps.
a sensible application instance scaling to keep the total database connections under 1000 across all the application instances to minimize the noisy neighbour impacts.
research your infrastructure imposed connection time limits and, then set the maximum lifetime and connection timeout appropriately.
Overview
A critical spring boot application for a major shipping company uses Oracle as the datastore. The database server also hosts databases for other unrelated applications. The critical application would behave and perform well when running in a VM, but when deployed in Pivotal Cloud Foundry (PCF), all the other applications in the same PCF org/space encountered severe performance degradation.
I outline the technique used to identify/analyze the cause for performance degradation and, fine-tune the spring boot application to minimize the noisy neighbor impact on other applications.
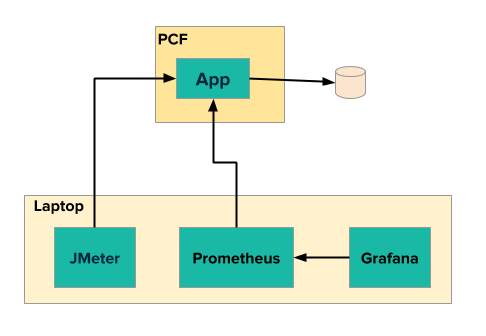
Tools
- Micrometer to expose the metrics from the spring boot application
- Prometheus to store and time-series aggregation of metric data
- Grafana to visualize the aggregated metric data from Prometheus
- Docker to run Prometheus and Grafana in containers.
- JMeter for load tests
Setup
Configure
ActuatorandPrometheus Registryin your Spring Boot 2.x appbuild.gradledependencies { ... implementation 'org.springframework.boot:spring-boot-starter-web' implementation 'org.springframework.boot:spring-boot-starter-actuator' implementation 'io.micrometer:micrometer-registry-prometheus' ... }GIT clone this repo [https://github.com/pbelathur/spring-boot-performance-analysis.git]
Replace
LOCAL_MACHINE_IPwith the actual IP address of the machine running Docker inspring-boot-performance-analysis/docker/prometheus.ymlscrape_configs: - job_name: 'performance-troubleshooter' scrape_interval: 5s metrics_path: '/actuator/prometheus' static_configs: - targets: ['LOCAL_MACHINE_IP:PORT']- LOCAL_MACHINE_IP is NOT
localhostOR127.0.0.1as the prometheus and grafana is running as docker container. - PORT is the Spring Boot application port usually 8080
- LOCAL_MACHINE_IP is NOT
Start Prometheus and Grafana on your computer:
docker-compose upVerify Prometheus can communicate with your spring boot application
- using a web browser access
http://localhost:9090/targets
- using a web browser access
Verify Grafana can communicate with Prometheus
- using a web browser access
http://localhost:3000 - under the
Recently viewed dashboardslook for the entrySpring Boot 2.1 Statistics - click on
Spring Boot 2.1 Statisticsand look forInstance =LOCAL_MACHINE_IP:PORTspecified inprometheus.yml
- using a web browser access
Setup JMeter load test with REST API endpoint on your spring boot app with
number-of-threads=240,ramp-up-period=30sandloop-count=25- Refer to https://octoperf.com/blog/2018/04/23/jmeter-rest-api-testing/ for JMeter setup for REST endpoint load tests.
Execution
Start your Spring Boot application
Start JMeter load test on your computer
During the execution of the load test, access http://localhost:3000 –> HikariCP Statistics section in Spring Boot 2.1 Statistics dashboard
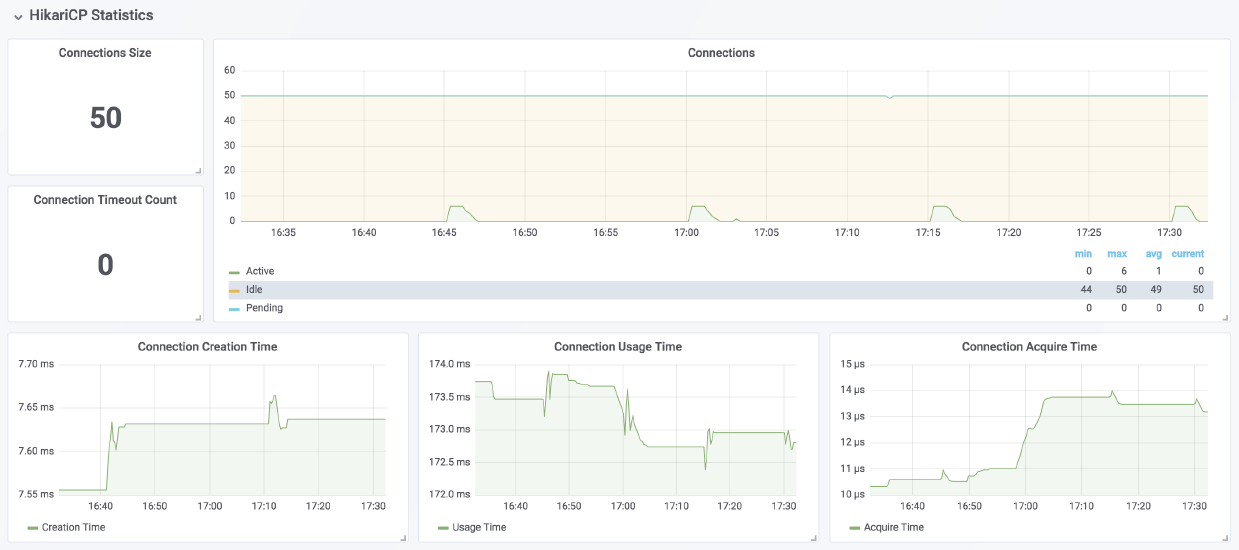
- Connection Size is the total connections in DB connection pool (
active + idle + pending). - Connections is the count of
active+idle+pendingconnections over a rolling time window. - Connection Usage Time is approximately equal to
db query execution time. - Connection Acquire Time
- Connection Creation Time
- Connection Size is the total connections in DB connection pool (
Observations
| Situation | active | idle | pending | Notes |
|---|---|---|---|---|
| noisy neighbor | 0 | > maximumPoolSize / 2 and > minimumIdle | 0 | if this condition is observed under no-request scenario and after considerable time since the last request, then the spring boot app is a potential noisy neighbor, as idle connections are not returned to the pool and, they consume system resources on the database server which increase connection times, decrease throughput for other applications using the same database server. |
| sweet spot | maximumPoolSize | <=minimumIdle | < 2 x maximumPoolSize | best possible in terms of database performance, utilization and minimize chance for app to be a noisy neighbor. |
| inadequate connections | maximumPoolSize | <= minimumIdle | >3 x maximumPoolSize | if consistent spike is noticed in Connection Usage Time, then increase connection pool size in steps of 2 until you see performance improvement. |
If Connections <
active + idle + pendingthere is a potential memory leak in the spring boot application that needs further investigation using memory/thread dump analysis.
Analysis
A spring boot application with a service taking 50ms to complete a database query using a single connection is used to provide insights in calculating the connection pool size, idle pool size and timeouts.
Connection Pool Size
spring.datasource.hikari.maximum-pool-size50ms/database query=>200 database queries/secper connectionIf
pool size = 10 connectionson a single app instance, then we can handle200 X 10 = 2000 queries/secper instance.if we scale the apps instance to 20, we can handle
2000 x 20 = 40,000 queries/secamong 20 instances, by using10 x 20 = 200 connectionsKeeping
pool size <= 10 connectionsper app instance and sensible app instance scaling to keep thetotal db connections < 1000across all app instances (especially for Oracle) results in minimizing the noisy neighbour impacts in PCF.
Idle Timeout
spring.datasource.hikari.idle-timeoutthe 10s default is high for most applications; set this value slightly higher than the average database query time. so that the connections are reclaimed faster preventing too many idle connections in pool. (e.g.
average database query time = 50ms,idle-timeout = 100ms)
Maximum lifetime
spring.datasource.hikari.max-lifetimethis should be set several seconds shorter than any database or infrastructure imposed connection time limit. The main idea here is the application needs to timeout before the infrastructure imposed connection time limit.
Connection Timeout
spring.datasource.hikari.connection-timeoutthe 30s default might be high for time critical apps, hence set the value based on the
time criticalityof the app. With 5s-10s for time critical applications. Making this value too small will result in SQLExceptions flooding the logs.
Sample HikariCP Configuration
# maximum db connections in pool
spring.datasource.hikari.maximum-pool-size=10

# minimum number of idle connections maintained by HikariCP in a connection pool
spring.datasource.hikari.minimum-idle=3

# maximum idle time for connection
spring.datasource.hikari.idle-timeout=100  # 100ms

# maximum number of milliseconds that a client will wait for a connection from pool
spring.datasource.hikari.connection-timeout=10000 # 10s

# maximum lifetime in milliseconds of a connection in the pool after it is closed.
spring.datasource.hikari.max-lifetime=120000 # 2m